New package: GetBCBData
Importing datasets from BCB (Banco Central do Brasil)
The Central Bank of Brazil (BCB) offers access to the SGS system (sistema gerenciador de series temporais) with a official API available here.
Over time, I find myself using more and more of the available datasets in my regular research and studies. Last weekend I decided to write my own API package that would make my life (and others) a lot easier.
Package GetBCBData can fetch data efficiently and rapidly:
- Use of a caching system with package
memoiseto speed up repeated requests of data; - Users can utilize all cores of the machine (parallel computing) when fetching a large batch of time series;
- Allows the choice for format output: long (row oriented, tidy data) or wide (column oriented)
- Error handling internally. Even if requested series does not exist, the function will still return all results.
Installation
# CRAN (official release) - IN CHECK
install.packages('GetBCBData')

# Github (dev version)
devtools::install_github('msperlin/GetBCBData')
A simple example
Let’s have a look at unemployment rates around the world. After searching for the ids in the SGS system, we find the ids for 6 countries and set it as input id.
Now, let’s download the data with GetBCBData:
#devtools::install_github('msperlin/GetBCBData')

library(GetBCBData)
library(tidyverse)

my.countries <- c('Germany', 'Canada', 'USA',
                  'France', 'Italy', 'Japan')

my.ids <- c(3785:3790)

names(my.ids) <- paste0('Unemp. rate - ', my.countries)

df.bcb <- gbcbd_get_series(id = my.ids ,
                           first.date = '2000-01-01',
                           last.date = Sys.Date())

glimpse(df.bcb)
## Rows: 1,196
## Columns: 4
## $ ref.date <date> 2000-01-01, 2000-02-01, 2000-03-01, 2000-04-01, 2000-05-…
## $ value <dbl> 8.2, 8.1, 8.1, 8.0, 8.0, 8.0, 7.9, 7.9, 7.9, 7.8, 7.8, 7.…
## $ id.num <int> 3785, 3785, 3785, 3785, 3785, 3785, 3785, 3785, 3785, 378…
## $ series.name <chr> "Unemp. rate - Germany", "Unemp. rate - Germany", "Unemp.…p <- ggplot(df.bcb, aes(x = ref.date, y = value) ) +
geom_line() +
labs(title = 'Unemploymnent Rates Around the World',
subtitle = paste0(min(df.bcb$ref.date), ' to ', max(df.bcb$ref.date)),
x = '', y = 'Percentage*100') + facet_wrap(~series.name)
print(p)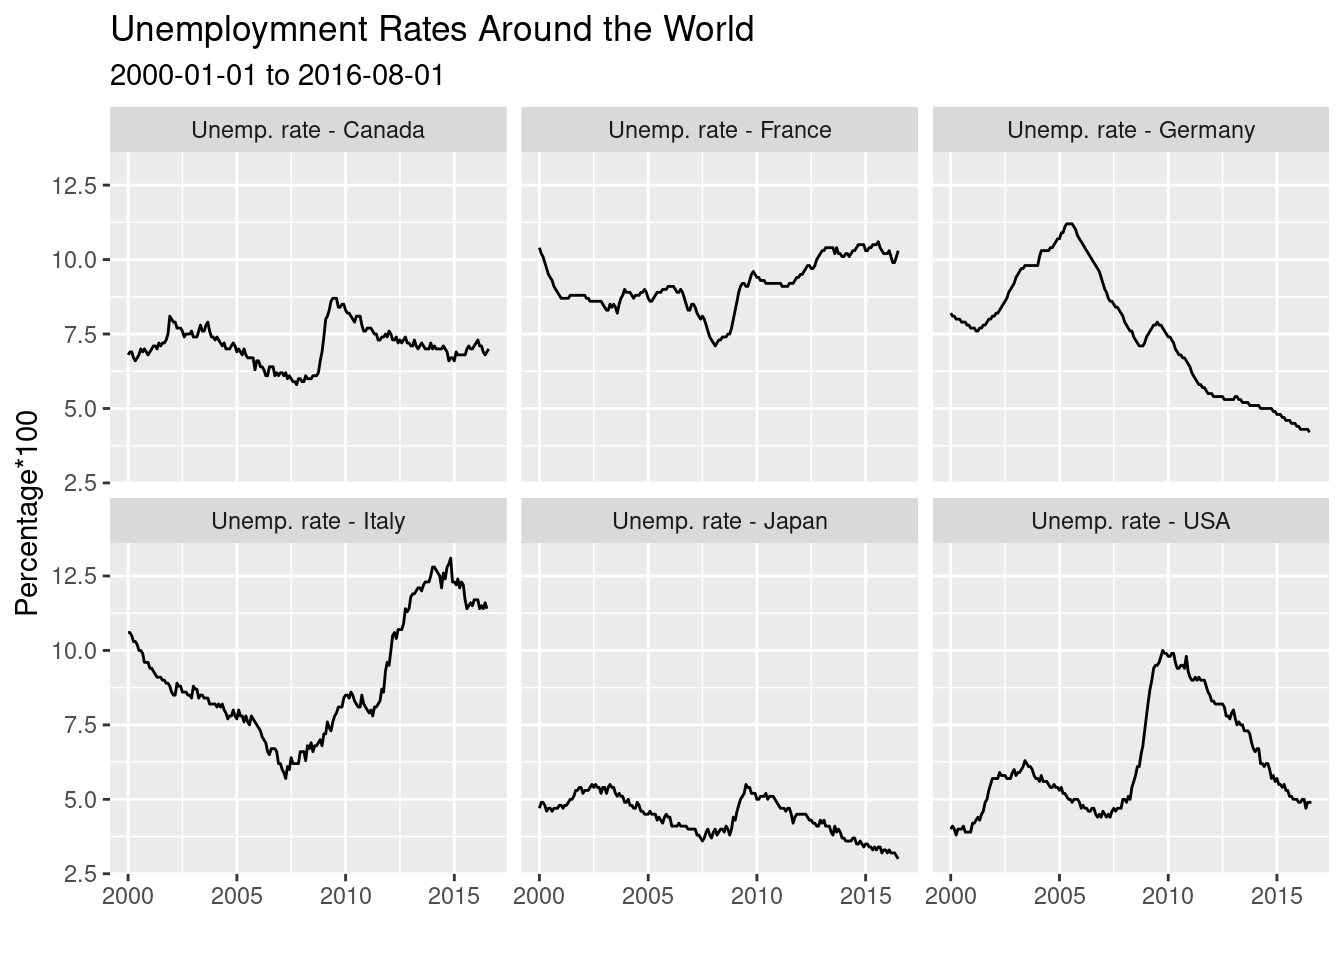
Marcelo S. Perlin
Associate Professor
My research interests include data analysis, finance and cientometrics.