The Use of AI in 10-K Filings
An Empirical Analysis on Russell 1000 Constituent Companies (2018-2024)
Federal University of Rio Grande do Sul (UFRGS)
2026-08-26
The paper is published at FRL
Introduction: AI in Corporate Reporting
Generative AI and Large Language Models (LLMs) in financial narrative drafting
- Critical Channels: Financial reports (10-Ks) are the cornerstone of corporate information disclosure for investors.
- The AI Shift: Rise of LLMs (ChatGPT, Gemini, Claude) allows managers to automate report writing.
- Core Question: How much and which types of firms rely on AI-assisted writing in annual reports?
Incentives and Risks of AI in Corporate Reporting
Incentives to use AI
- Streamlines administrative processes and minimizes cost
- Frees manager time for decision-making
- Enhances narrative readability
Problems
- Generates artificial or generic text
- Risk of “hallucinations”
- Potential loss of legal precision
- Misleading investors with overly positive tone
Research Scope & Objectives
Key questions and target text segments in 10-K filings
Three Core Questions
- Prevalence: How much AI is used in writing corporate annual reports?
- Determinants: Which firm characteristics predict AI adoption?
- Tone: How does AI-assisted writing associate with disclosure sentiment?
10-K Narrative Sections: BD, RF, and MD
Understanding the three core text segments analyzed
- BD (Business Description - Item 1):
- Details the company’s core operations, products, services, subsidiaries, and target markets.
- Highly descriptive and standardizable, providing a fundamental snapshot of the business.
- RF (Risk Factors - Item 1A):
- Discloses significant risks that could adversely affect the firm’s financial condition or stock price.
- High-stakes section requiring precise legal language and cautionary tone to prevent liability.
- MD (Management’s Discussion and Analysis - Item 7):
- Management’s perspective on financial results, liquidity, capital resources, and known trends.
- Analytical and forward-looking, explaining the “why” behind the financial numbers.
Data & Sample Construction
Data collection scope and final descriptive sample
Sources & Scope
- Text Source: 10-K sections (BD, RF, MD) retrieved directly from the official SEC API using
EdgarTools(Python). - Financial Data: Russell 1000 index constituents and financial ratios from
EODHD. - Coverage: Represents \(\approx\) 90% of the traded volume in American stock exchanges.
- Timeline: 2018 to 2024 (spanning pre-hype and post-ChatGPT periods).
3,939 Observations
Matched company-year narrative and financial data points.
18% Data Loss
Standard attrition due to matching textual and financial filings.
570 Unique Firms
Large cross-section representing established American corporations.
Three Databases
Separate textual corpora compiled for BD, RF, and MD sections.
Methodology: AI Detection & Processing
Fine-tuning FinBERT and aggregating segment-level probabilities
The AI Detector Model
- Base: Fine-tuned on
yiyanghkust/finbert-pretrainfor financial context. - Ground Truth:
- 3,000 pre-AI chunks (2015-2020) as Human.
- Paraphrased via Gemini 2.5 Flash, ChatGPT, and Claude Haiku as AI.
- Splitting: 70% Train, 30% Test.
Robust Test Metrics
- Accuracy: 89.17% | F1-Score: 88.58%
- Precision: 92.65% (minimal false positives)
- Recall: 84.85%
Text Processing & Sentiment
- Sliding Window Technique:
- FinBERT is limited to 512 tokens.
- Solution: Chunks of 500 tokens with 50 overlap (10%).
- AI score = simple average of chunk probabilities.
- Sentiment Score:
- Standard FinBERT classifier applied to chunks.
- Ignored neutral chunks.
- Score = Average of positive (+1) and negative (-1) chunks.
Descriptive Statistics
Summary of company variables and text indicators (2018-2024)
| Variable | N | Mean | Std Dev | Min | Max |
|---|---|---|---|---|---|
| Panel A: Company Variables | |||||
| ROE | 6,301 | 0.206 | 5.755 | -105.913 | 239.107 |
| ROA | 6,301 | 0.055 | 0.413 | -8.949 | 21.117 |
| IPO Year (Median) | 6,098 | 1997 | 15 | 1919 | 2024 |
| Age (years since IPO) | 6,098 | 23.0 | 14.8 | -6.0 | 105.0 |
| Log Size | 6,301 | 10.122 | 0.647 | 7.389 | 12.602 |
| Leverage | 6,301 | 0.693 | 3.020 | 0.000 | 238.549 |
| Beta (Market Risk) | 6,156 | 1.019 | 0.474 | -4.054 | 5.950 |
| Asset Turnover | 6,301 | 0.718 | 2.326 | -0.069 | 95.086 |
| Accrual Ratio | 6,301 | 0.024 | 0.628 | -1.897 | 44.745 |
| Panel B: Text Variables | |||||
| BD Score (AI Prob) | 5,405 | 0.178 | 0.095 | 0.009 | 0.959 |
| RF Score (AI Prob) | 5,465 | 0.129 | 0.063 | 0.011 | 0.845 |
| MD Score (AI Prob) | 5,483 | 0.158 | 0.085 | 0.007 | 0.849 |
| BD Sentiment | 6,294 | 0.301 | 0.624 | -1.000 | 1.000 |
| RF Sentiment | 6,294 | -0.843 | 0.352 | -1.000 | 1.000 |
| MD Sentiment | 6,294 | -0.170 | 0.426 | -1.000 | 1.000 |
Core Insight: Business Description (BD) has the highest average AI usage (17.8%). Text sentiments conform to purpose: Risk Factors is highly negative, while BD is positive.
Research Hypotheses & Variables
Explanatory variables and predicted signs with AI usage
| Variable | Predicted Sign | Core Theoretical Rationale |
|---|---|---|
| ROE (Profitability) | + | Richer firms have resources to adopt emerging AI tools. |
| Age (Maturity) | - | Younger firms are agile and less resistant to workflow changes. |
| Log Size (Scale) | - | Larger firms face bureaucratic inertia and manual reporting layers. |
| Risk (Beta) | + | High-risk firms require extensive and polished explanations. |
| Leverage | + | Highly leveraged firms face more creditor and investor scrutiny. |
| Sentiment | + | LLMs naturally generate polished, positive, and neutral corporate drafts. |
| Asset Turnover | + | Operationally efficient firms prioritize administrative process automation. |
| Accrual Ratio | + | Accounting complexity requires detailed technical narratives. |
Econometric Framework
Generalized Linear Models (GLM) specification
Why GLM?: Probability \(p(AI)_{i,t}\) is bounded on \([0,1]\). Standard OLS is misspecified.
Specification: Quasibinomial distribution with a logit link function:
\[\mathbb{E}(AI_{i,t}) = \frac{1}{1 + e^{-z_{i,t}}}\]
\[z_{i,t} = \alpha + \theta X_{i,t}\]
Controls: Sector dummies & year fixed effects.
Sample: Limited to 2022–2024 (post-ChatGPT launch).
Trend Analysis: AI Probability Over Time
Temporal patterns of AI-assisted writing probability across 10-K sections
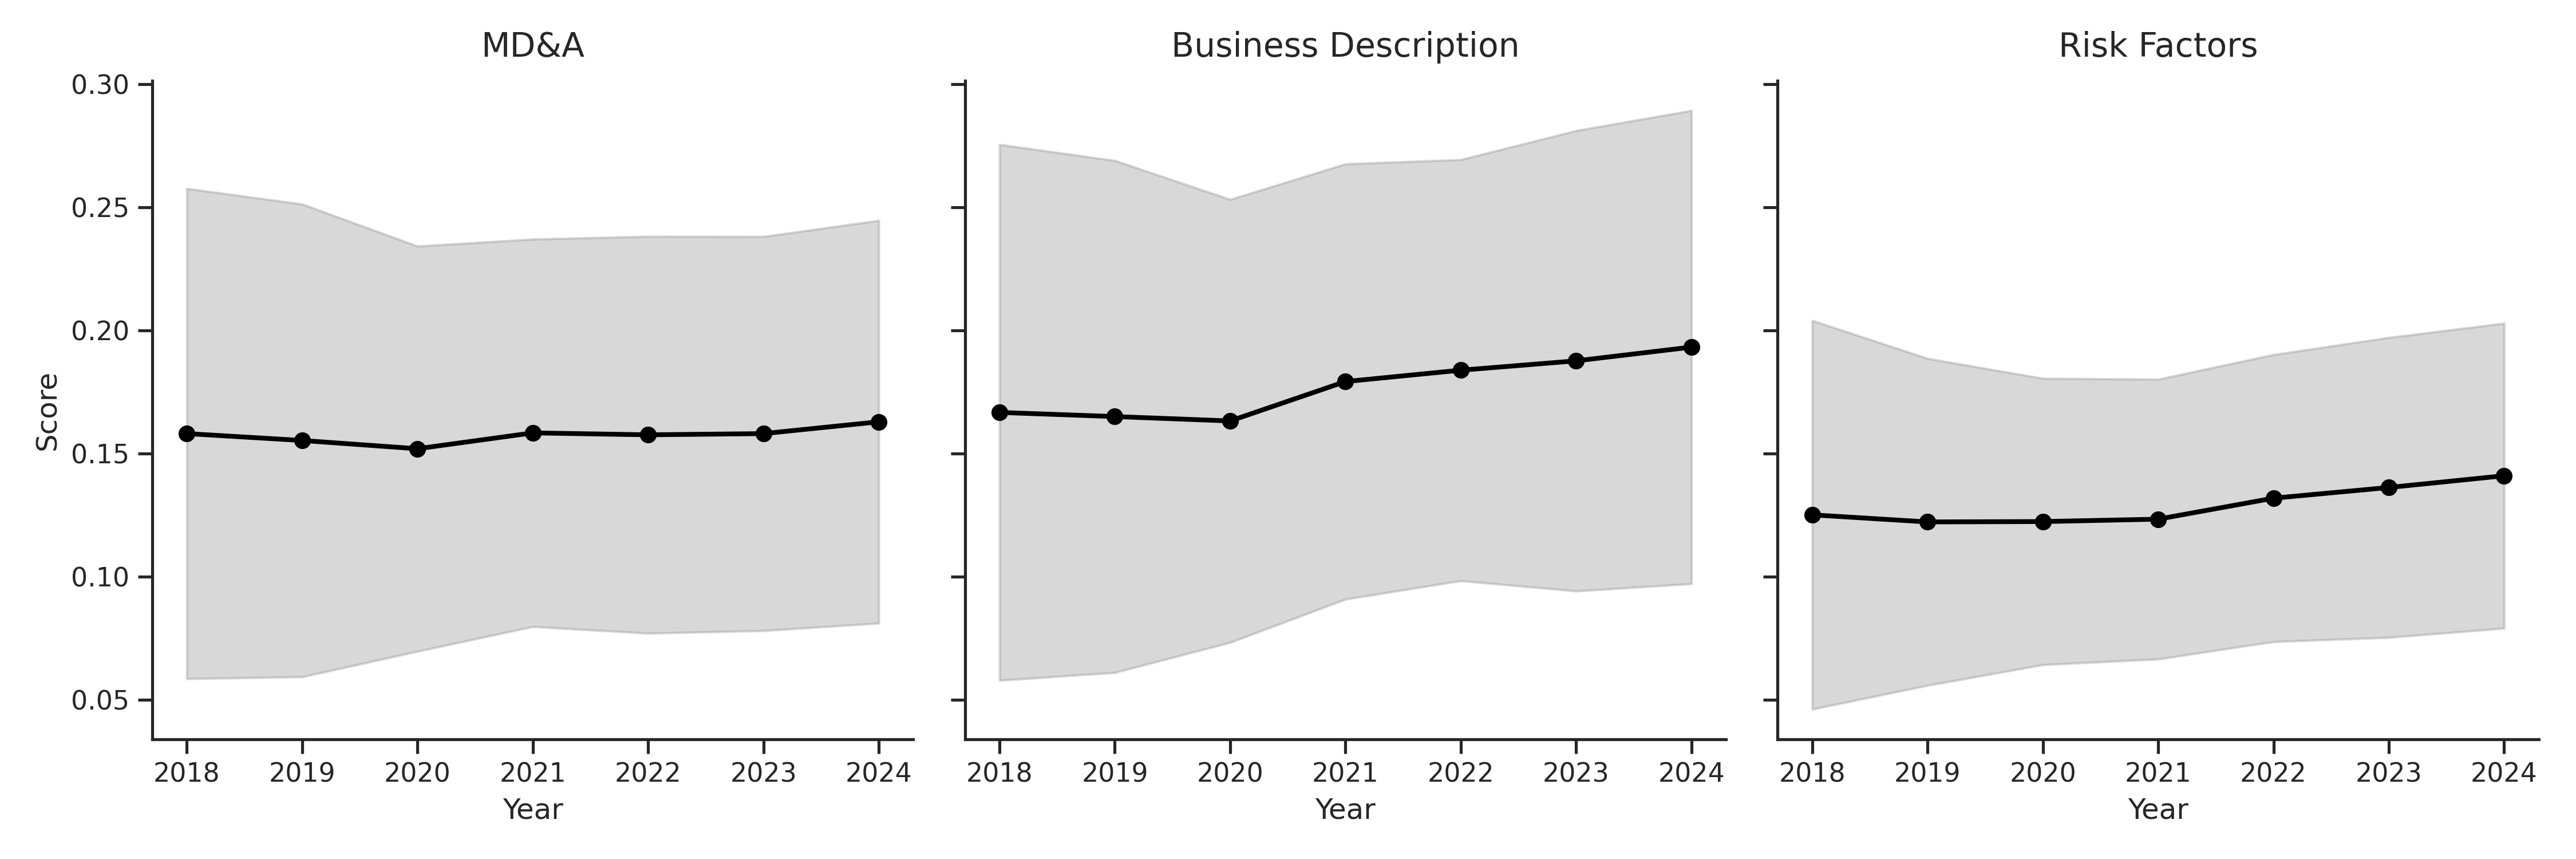
Average AI score per 10-K text segment per year
Key Takeaways
- Stable Adoption: Probability remains relatively steady over the 2018–2024 period.
- Constant Ordering:
- Business Description (BD): Highest (\(\approx\) 17.8%)
- Management Discussion (MD): Intermediate (\(\approx\) 15.8%)
- Risk Factors (RF): Lowest (\(\approx\) 12.9%)
- 2024 Divergence: Error bands widen in 2024, showing that a subset of firms is adopting AI aggressively.
The “ChatGPT Shock” & Structural Breaks
Chow structural break tests around ChatGPT public release (2022)
Structural Break Findings
- Hypothesis: ChatGPT launch in late 2022 created a structural break in corporate AI adoption.
- Methodology: Chow test on annual averages using an intercept-only model (\(y_t = \alpha + \epsilon_t\)) with 2022 as breakpoint.
- Results:
- Risk Factors (RF): Highly significant structural break (\(p = 2.29\%\)).
- Business Description (BD): Moderate break (\(p = 10.12\%\)).
- Management Discussion (MD): Inconclusive (\(p = 15.17\%\)).
Structural Break Results (Chow)
| 10-K Section | Mean Before | Mean After | F-Stat | p-value |
|---|---|---|---|---|
| Business Description | 16.85% | 18.78% | 4.501 | 10.12% |
| Risk Factors | 12.16% | 13.56% | 12.923 | 2.29% |
| Management Discussion | 15.44% | 15.86% | 3.128 | 15.17% |
Data shows statistically robust evidence of a structural upward shift in AI usage after 2022, especially in high-stakes Risk Factors.
Sentiment Dynamics in 10-K Narratives
Distribution of FinBERT sentiment scores across 10-K sections
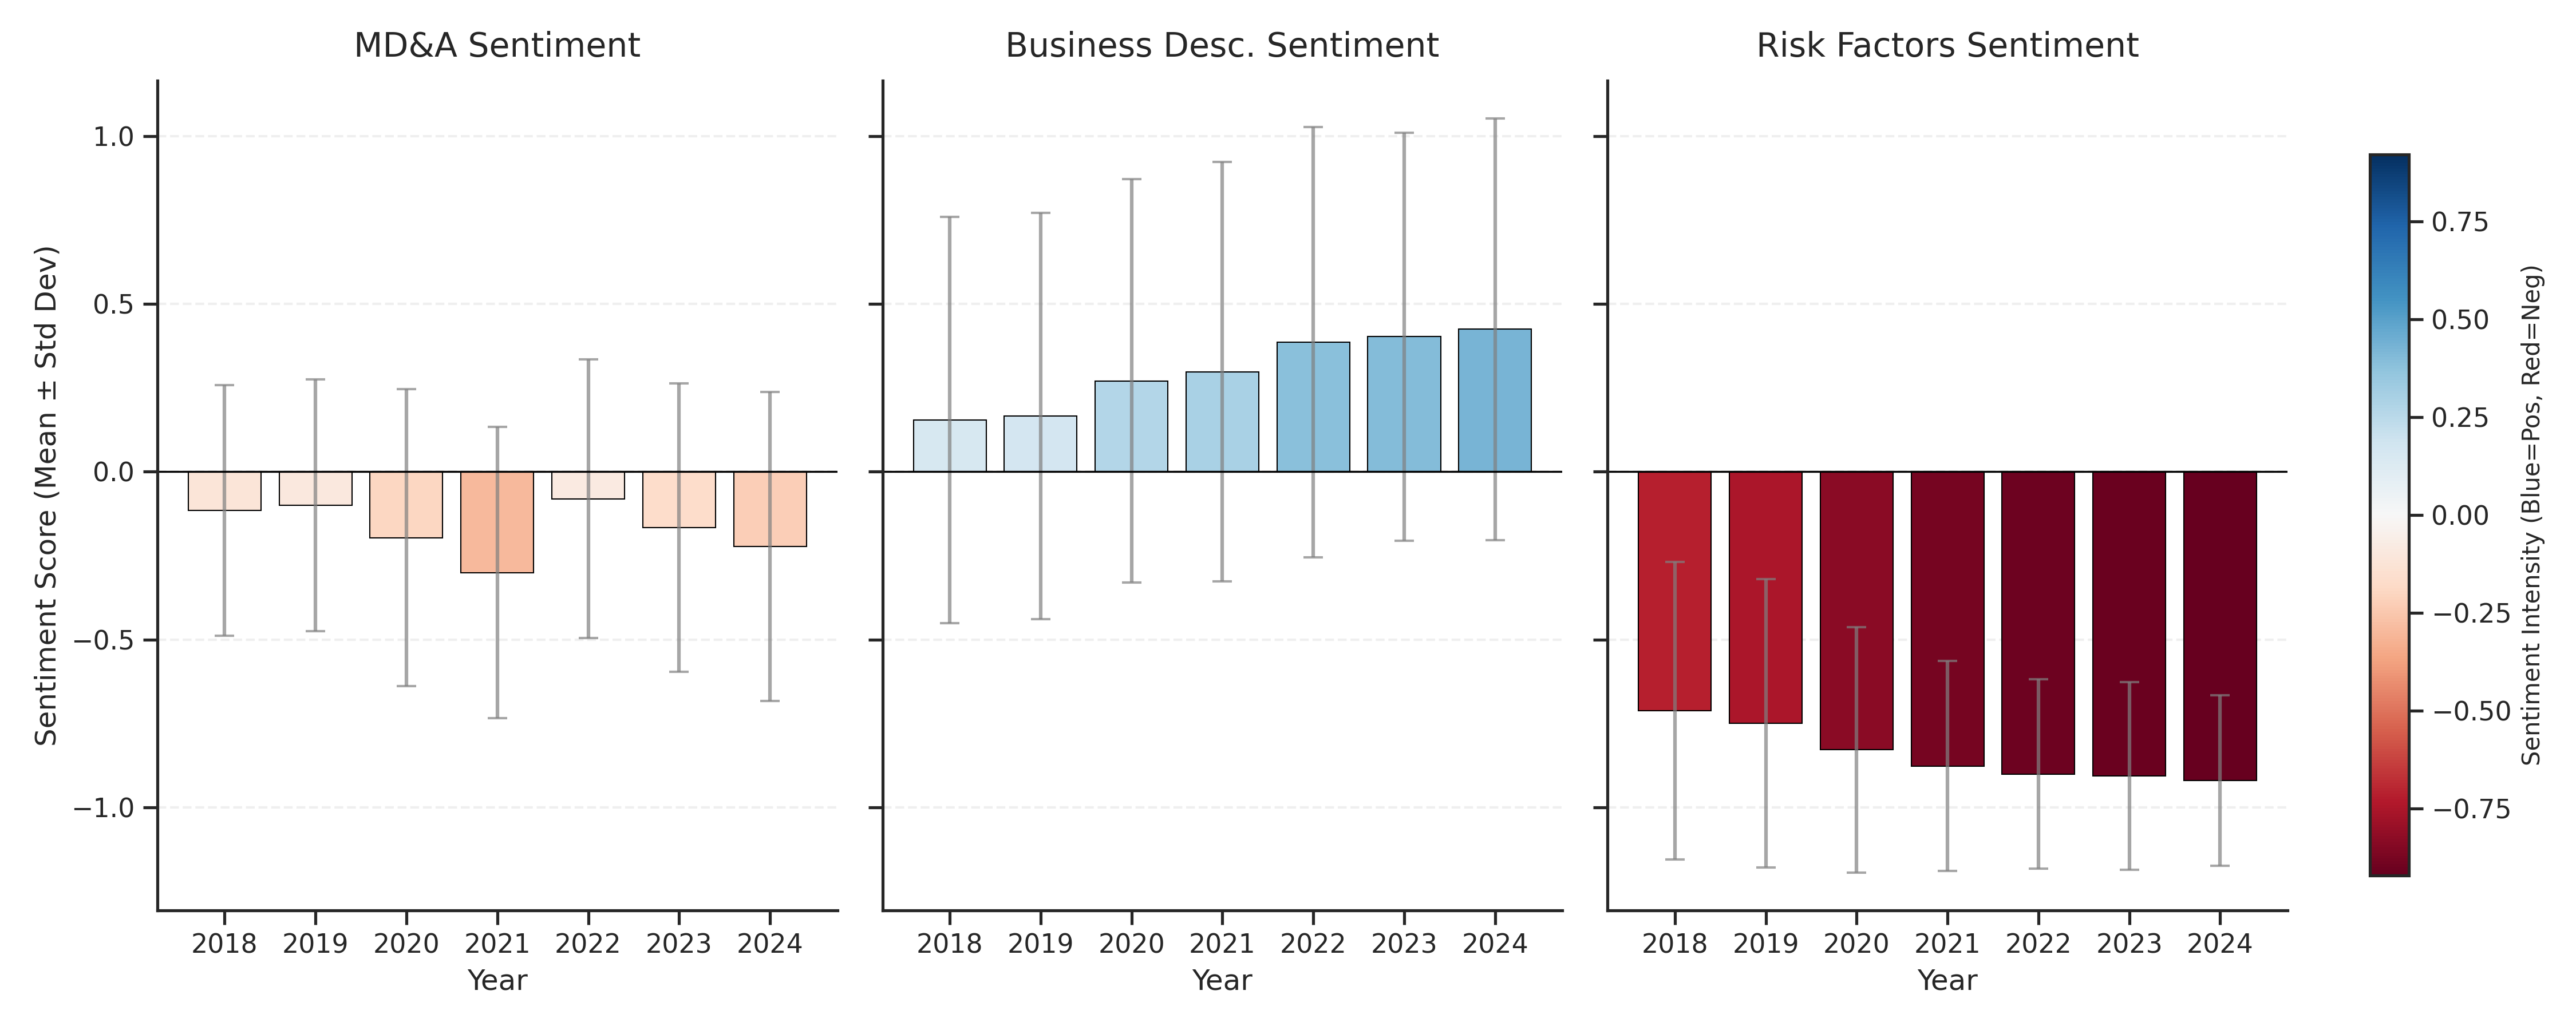
Distribution of sentiment score per 10-K text segment
Econometric Results: Pooled GLM
Determinants of AI-assisted writing (2022-2024)
| Variable | Business Description (BD) | Risk Factors (RF) | Management Discussion (MD) |
|---|---|---|---|
| ROE (Profitability) | -0.027 (0.019) | -0.001 (0.016) | -0.004 (0.020) |
| Age (Maturity) | 0.003 (0.001)\(^{***}\) | -0.003 (0.001)\(^{***}\) | 0.002 (0.001)\(^{*}\) |
| Log Size (Scale) | -0.077 (0.026)\(^{***}\) | 0.153 (0.021)\(^{***}\) | 0.024 (0.026) |
| Risk (Beta) | 0.026 (0.030) | 0.065 (0.025)\(^{**}\) | 0.014 (0.031) |
| Leverage | -0.024 (0.056) | 0.008 (0.047) | -0.127 (0.058)\(^{**}\) |
| Sentiment | -0.016 (0.019) | 0.196 (0.089)\(^{**}\) | -0.025 (0.027) |
| Asset Turnover | 0.018 (0.025) | 0.056 (0.021)\(^{***}\) | 0.049 (0.026)\(^{*}\) |
| Accrual Ratio | -0.739 (0.203)\(^{***}\) | -0.314 (0.170)\(^{*}\) | -0.299 (0.211) |
| Year | 0.038 (0.014)\(^{***}\) | 0.048 (0.012)\(^{***}\) | 0.023 (0.015) |
| Sector Dummies | Yes | Yes | Yes |
| Deviance | 115.543 | 63.518 | 104.962 |
| Observations | 2,409 | 2,409 | 2,409 |
Note: Standard errors are in parentheses. \(^{*}p<0.1\); \(^{**}p<0.05\); \(^{***}p<0.01\). Profitability (ROE) is insignificant in all sections.
Econometric Findings & Core Interpretations
Economic takeaways from firm-level determinants of AI usage
Firm Characteristics
- ROE (Profitability):
- Insignificant. Reject budget-constraint hypothesis: AI is not a luxury tool.
- Firm Age (Maturity):
- Older firms use AI in BD and MD; younger in RF. Mature firms automate operational descriptions.
- Firm Size (Scale):
- Larger firms use AI to write Risk Factors, but avoid it in BD descriptions.
Fundamentals & Complexity
- Operational Efficiency (Turnover):
- Positively predicts AI in RF and MD sections.
- Highly efficient firms use automation to cut administrative friction.
- Accounting Complexity (Accruals):
- Negatively predicts AI in BD and RF.
- Complex firms avoid AI in narrative disclosures, likely fearing inaccuracies.
- Financial Risk (Leverage):
- Negatively predicts AI in MD. Leveraged firms avoid AI due to close creditor monitoring.
Discussion: Strategic Framing & Regulatory Impact
Efficiency gains vs impression management in corporate reporting
Efficiency vs Legal Caution
- Operational Optimization:
- BD section has the highest AI adoption. Writing BD is routine and descriptive. Managers optimize standardizable tasks using AI.
- Risk Avoidance in High-Stakes Text:
- Lower AI adoption in MD and RF sections. Managers avoid automated text where precise legal language is crucial, fearing liability.
Strategic Polish (Impression Management)
- Tone Polishing in Risk Factors:
- Strong positive link between sentiment and AI in RF.
- Managers use LLMs’ positive-neutral prose bias to “polish” or soften the impact of risk disclosures.
- Trade-Off: Improves text readability but risks introducing boilerplate, generic disclosures, exacerbating information asymmetry.
Conclusion
Summary of academic contributions and practical takeaways
- AI Classifier: Developed fine-tuned, high-precision (92.65%) FinBERT-based corporate text AI detector.
- Prevalence Patterns: Documented systematic, section-dependent AI adoption in 10-K reports (BD \(>\) MD \(>\) RF).
- Tone Management: Provided first empirical evidence of dynamic “tone polishing” in Risk Factors using AI.
Present studies
Predicting layoff announcements from 10-Ks using LLMs (AI). Joint work with Felipe Affonso
Analyzing personality based on pictures and signatures of CEOs, and its impact on financial performance. Joint work with Aliki K. Galanos
The impact of AI in a large academic system. TBD
Thank You!
Questions?
AI in Corporate Finance - Finance Research Letters (2026)