Update to GetLattesData
Last year I released GetLattesData. This package is very handy for anyone that researches bibliometric data of Brazilian scholars. You could easily import the whole academic history of any researcher registered at the platform. More details about Lattes and GetLattesData in the this post.
However, a couple months ago CNPQ introduced a captcha in the webpage. This made it impossible to download the xml files directly, breaking my code. It seems that those changes are now permanent. The update to GetLattesData will address this issue by asking the user to download the files manually and input its location to function gld_get_lattes_data_from_zip. Unfortunately, one can no longer download the files automatically.
Next I provide an example of usage from the vignette:
library(GetLattesData)

# get files from pkg (you can download from other researchers in lattes website)
f.in <- c(system.file('extdata/3262699324398819.zip', package = 'GetLattesData'),
          system.file('extdata/8373564643000623.zip', package = 'GetLattesData'))

# set qualis
field.qualis = 'ADMINISTRAÇÃO PÚBLICA E DE EMPRESAS, CIÊNCIAS CONTÁBEIS E TURISMO'

# get data
l.out <- gld_get_lattes_data_from_zip(f.in,
                                      field.qualis = field.qualis )
##
## Reading 3262699324398819.zip - Marcelo Scherer Perlin
## Found 21 published papers
## Found 2 accepted paper(s)
## Found 10 supervisions
## Found 2 published books
## Found 0 book chapters
## Found 17 conference papers
## Reading 8373564643000623.zip - Denis Borenstein
## Found 75 published papers
## Found 2 accepted paper(s)
## Found 97 supervisions
## Found 1 published books
## Found 6 book chapters
## Found 89 conference papersThe output my.l is a list with the following dataframes:
names(l.out)## [1] "tpesq" "tpublic.published" "tpublic.accepted"
## [4] "tsupervisions" "tbooks" "tconferences"The first is a dataframe with information about researchers:
tpesq <- l.out$tpesq
str(tpesq)
## tibble [2 × 16] (S3: tbl_df/tbl/data.frame)
## $ name : chr [1:2] "Marcelo Scherer Perlin" "Denis Borenstein"
## $ last.update : Date[1:2], format: "2018-09-24" "2018-08-24"
## $ bsc.institution: chr [1:2] "Universidade Federal de Santa Maria" "Universidade Federal do Rio de Janeiro"
## $ bsc.start.year : chr [1:2] "2001" "1981"
## $ bsc.end.year : chr [1:2] "2005" "1986"
## $ bsc.course : chr [1:2] "Administração de empresas" "Engenharia Naval"
## $ msc.institution: chr [1:2] "Universidade Federal do Rio Grande do Sul" "Universidade Federal do Rio Grande do Sul"
## $ msc.start.year : chr [1:2] "2005" "1989"
## $ msc.end.year : chr [1:2] "2007" "1991"
## $ phd.institution: chr [1:2] "University of Reading" "University of Strathclyde"
## $ phd.start.year : num [1:2] 2007 1991
## $ phd.end.year : num [1:2] 2010 1995
## $ country.origin : chr [1:2] "Brasil" "Brasil"
## $ major.field : chr [1:2] "CIENCIAS_SOCIAIS_APLICADAS" "ENGENHARIAS"
## $ minor.field : chr [1:2] "Administração" "Engenharia de Produção"
## $ id.file : chr [1:2] "3262699324398819.zip" "8373564643000623.zip"The second dataframe contains information about all published publications, including Qualis and SJR:
dplyr::glimpse(l.out$tpublic.published)## Rows: 96
## Columns: 13
## $ id.file <chr> "3262699324398819.zip", "3262699324398819.zip", "3…
## $ name <chr> "Marcelo Scherer Perlin", "Marcelo Scherer Perlin"…
## $ article.title <chr> "Teoria do Caos aplicada aos Contratos de Café no …
## $ year <dbl> 2006, 2009, 2007, 2011, 2013, 2013, 2013, 2013, 20…
## $ language <chr> "Português", "Inglês", "Inglês", "Inglês", "Portug…
## $ journal.title <chr> "READ - Revista Eletrônica da Administração (UFRGS…
## $ contry.publication <chr> "Brasil", "", "", "", "", "", "", "", "", "", "", …
## $ ISSN <chr> "-", "1753-9641", "1413-2311", "1749-9135", "1679-…
## $ order.aut <dbl> 1, 1, 1, 1, 1, 1, 2, 1, 2, 1, 2, 2, 1, 1, 3, 1, 3,…
## $ n.authors <dbl> 2, 1, 2, 2, 1, 3, 3, 3, 2, 2, 3, 2, 4, 5, 3, 2, 5,…
## $ qualis <chr> NA, NA, "B1", NA, "B1", "A2", "B1", "A1", "B1", "B…
## $ SJR <dbl> NA, 0.213, NA, NA, NA, 0.886, NA, 0.429, NA, NA, N…
## $ H.SJR <int> NA, 6, NA, NA, NA, 17, NA, 38, NA, NA, NA, NA, 45,…Other dataframes in l.out included information about accepted papers, supervisions, books and conferences.
An application of GetLattesData
GetLattesData makes it easy to create academic reports for a large number of researchers. See next, where I plot the number of publications for each researcher, conditioning on Qualis ranking.
tpublic.published <- l.out$tpublic.published

library(ggplot2)

p <- ggplot(tpublic.published, aes(x = qualis)) +
  geom_bar(position = 'identity') + facet_wrap(~name) +
  labs(x = paste0('Qualis: ', field.qualis))
print(p)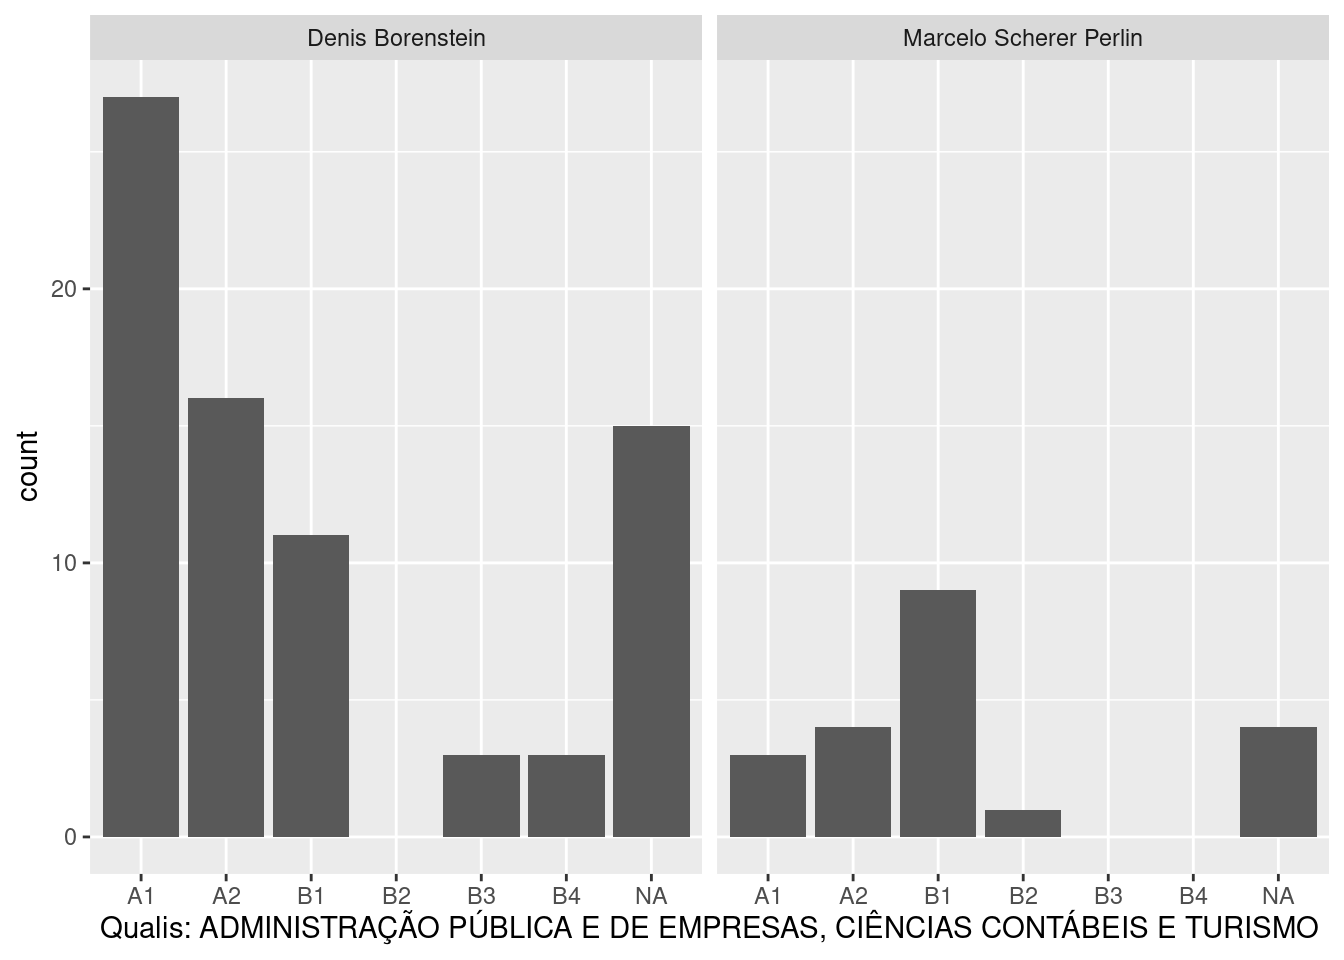
We can also use dplyr to do some simple assessment of academic productivity:
library(dplyr)##
## Attaching package: 'dplyr'## The following objects are masked from 'package:stats':
##
## filter, lag## The following objects are masked from 'package:base':
##
## intersect, setdiff, setequal, unionmy.tab <- tpublic.published %>%
group_by(name) %>%
summarise(n.papers = n(),
max.SJR = max(SJR, na.rm = T),
mean.SJR = mean(SJR, na.rm = T),
n.A1.qualis = sum(qualis == 'A1', na.rm = T),
n.A2.qualis = sum(qualis == 'A2', na.rm = T),
median.authorship = median(as.numeric(order.aut), na.rm = T ))
knitr::kable(my.tab)| name | n.papers | max.SJR | mean.SJR | n.A1.qualis | n.A2.qualis | median.authorship |
|---|---|---|---|---|---|---|
| Denis Borenstein | 75 | 3.674 | 1.2808113 | 27 | 16 | 2 |
| Marcelo Scherer Perlin | 21 | 2.029 | 0.7204444 | 3 | 4 | 1 |
Marcelo S. Perlin
Associate Professor
My research interests include data analysis, finance and cientometrics.