BatchGetSymbols 2.2
One of the main requests I get for package BatchGetSymbols is to add the choice of frequency of the financial dataset. Today I finally got some time to work on it. I just posted a new version of BatchGetSymbols in CRAN. The major change is that users can now set the time frequency of the financial data: dailly, weekly, monthly or yearly. Let’s check it out:
library(BatchGetSymbols)## Loading required package: rvest## Loading required package: xml2## Loading required package: dplyr##
## Attaching package: 'dplyr'## The following objects are masked from 'package:stats':
##
## filter, lag## The following objects are masked from 'package:base':
##
## intersect, setdiff, setequal, union## library(purrr)##
## Attaching package: 'purrr'## The following object is masked from 'package:rvest':
##
## plucklibrary(ggplot2)
my.fct <- function(my.freq) {
df <- BatchGetSymbols(tickers = c('GE'),
first.date = '2010-01-01',
last.date = Sys.Date(), do.cache = FALSE,
freq.data = my.freq)$df.tickers
df$freq <- my.freq
return(df)
}
my.possible.freq <- c('daily', 'weekly', 'monthly', 'yearly')
df.allfreq <- bind_rows(map(.x = my.possible.freq, .f = my.fct))##
## Running BatchGetSymbols for:##
## tickers =GE
## Downloading data for benchmark ticker
## ^GSPC | yahoo (1|1)
## GE | yahoo (1|1) - Got 100% of valid prices | Good job!
## Running BatchGetSymbols for:
## tickers =GE
## Downloading data for benchmark ticker
## ^GSPC | yahoo (1|1)
## GE | yahoo (1|1) - Got 100% of valid prices | You got it!
## Running BatchGetSymbols for:
## tickers =GE
## Downloading data for benchmark ticker
## ^GSPC | yahoo (1|1)
## GE | yahoo (1|1) - Got 100% of valid prices | Feels good!
## Running BatchGetSymbols for:
## tickers =GE
## Downloading data for benchmark ticker
## ^GSPC | yahoo (1|1)
## GE | yahoo (1|1) - Got 100% of valid prices | You got it!p <- ggplot(df.allfreq, aes(x=ref.date, y = price.adjusted)) +
geom_point() + geom_line() + facet_grid(freq ~ ticker)
print(p)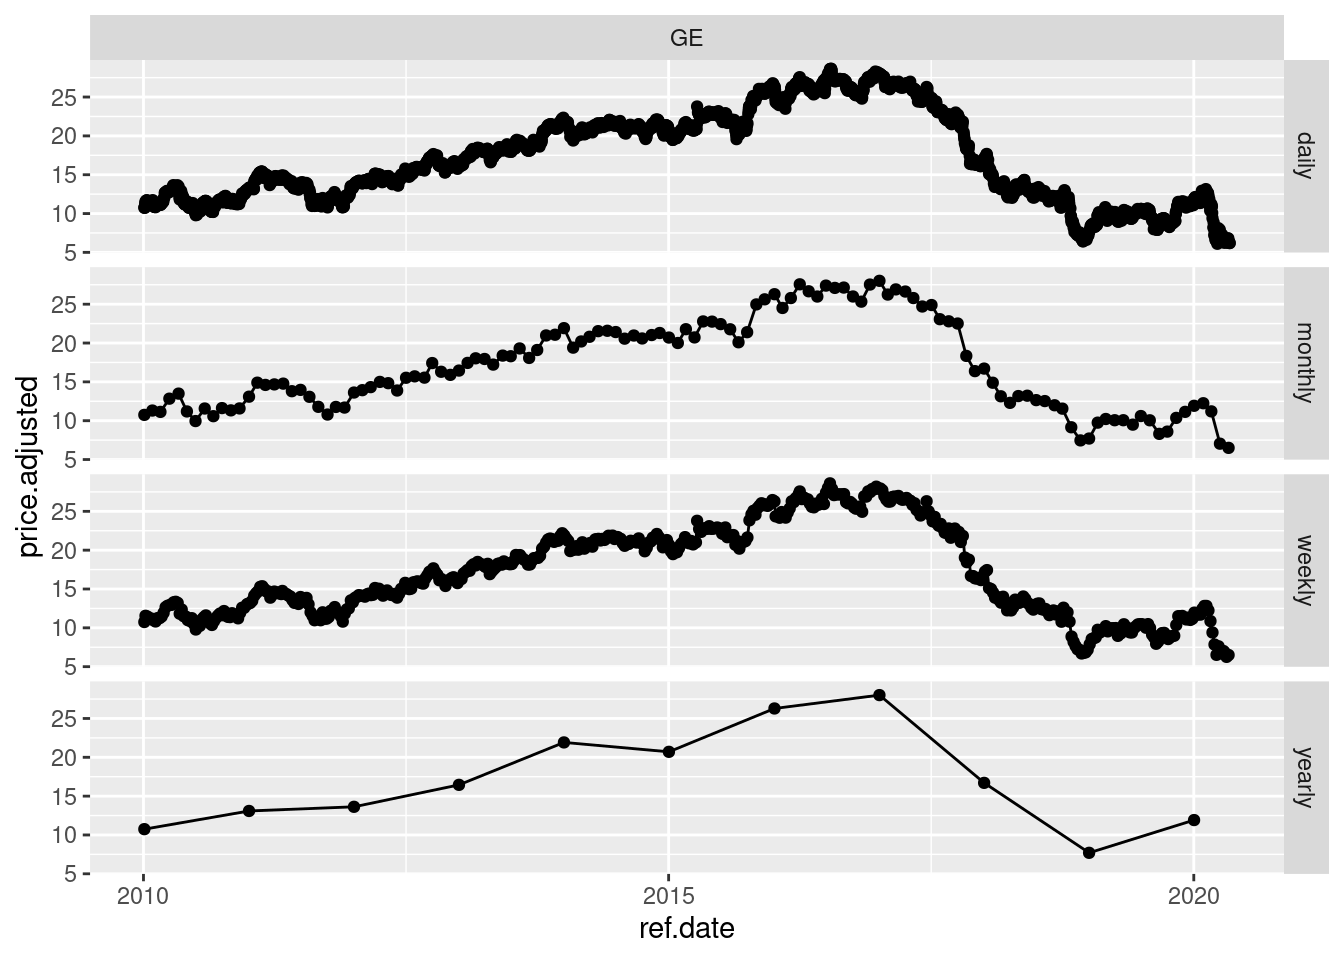
Marcelo S. Perlin
Associate Professor
My research interests include data analysis, finance and cientometrics.